Bearish Flag Pattern Explained

Jun 07, 2025
0
The Bearish flag is a charting pattern that is utilized by traders to recognize potential continuation of a downtrend. At its most basic, it resembles a small consolidation or pause following a steep decline in price. Following its end, price tends to break lower and resume the earlier decline. The pattern exists in stocks, forex, and cryptocurrencies, and is therefore a valuable tool for most market participants.
Bearish flag is a well-known pattern in technical analysis that indicates a potential continuation of an ongoing downtrend. It provides traders with an opportunity to catch a sell on an existing move rather than following a weakening move.
Throughout this article, we will dissect how a bearish flag is formed, the significance of the pattern, and how you should apply it in live trades. You should be able to confidently spot a bearish flag and use simple rules by the end of it.
Contents
- What is a Bearish Flag?
- Historical Background of the Bearish Flag
- Anatomy of the Bearish Flag Pattern
- How to Trade the Bearish Flag
- Technical Tools and Confirmation
- Real-World Examples and Case Studies
- Influential Analysts and Publications
- Limitations and Risks
- Practical Applications in Contemporary Markets
- Objective Analysis and Reflective Conclusions
- FAQ
What is a Bearish Flag?
A bearish Bearish flag forms when price drops steeply, forming the often-referred-to "flagpole." Following that decline, price trades in a tight, rising or flat channel for a brief moment. That temporary halt looks like a flag on a flagpole, which is how it got its name.
Imagine a ball rolling down a hill (the initial slope), striking a ledge (consolidation), and continuing to roll down (breakout). The ledge provides the ball with a temporary reprieve, yet gravity continues to pull it downward when the ledge is over.
In terms of the market, selling pressure overwhelms, and buyers are able to achieve a small, temporary push upward or sideways.
You may be asking how this is different from a bull flag. In a bull flag, price first advances, then it trends into a small downtrend before resuming higher. In this case, the bearish flag is essentially the reverse, indicating further downward movement.
Both patterns follow the same reasoning: a strong move in one direction, followed by short-term consolidation.
Historical Background of the Bearish Flag
Chart patterns like the bearish flag date back to classical technical analysis in the early 20th century. Analysts such as Richard Wyckoff and William D. Gann wrote about similar formations, though the exact term “flag” gained popularity later.
By the 1970s, traders and authors like Larry Williams began to highlight flag patterns explicitly. John Murphy's work from 1999, Technical Analysis of the Financial Markets, formalized the vocabulary of flags and pennants.
The author, in his book, described how flags tend to indicate continuation, in either an upward movement (bullish flag) or downward movement (bearish flag).
From that point, a myriad of educational sources such as Investopedia and StockCharts included examples, solidifying the pattern in contemporary trading.
Bear flags have appeared throughout the years in every market—from oil in the 1980s to technology stocks in the 2000s. More recently, cryptocurrency traders monitor flags in Bitcoin and altcoins for new areas of selling.
Regardless of instruments, the basic concept is the same: a formation indicating more downside risk.
Anatomy of the Bearish Flag Pattern
The initial component is the flagpole—a rapid and steep move that typically happens within days or weeks. Volume typically surges on a flagpole, and strong selling interest is indicated by this.
Then there is the flag itself, a brief consolidation period during which price fluctuates within two roughly parallel trendlines. These trendlines may slope upwards, lie flat, or even slope downwards slightly, although the most typical one slopes upwards at a shallow angle.
This rise or flat movement indicates buyers trying a small retracement, with buyers having insufficient strength to reverse the trend.
The volume will decline during the formation of the flag, as a reflection of decreasing trading activity and slowdown in the sell-off.
When the price crosses below the lower trendline of the flag, volume tends to increase. Such an increase in volume indicates sellers coming in again to drive the price further down, continuing the downtrend.
How to Trade the Bearish Flag
- Establish a clear prior downtrend
You need a strong initial decline in order for a flag to be more than a random consolidation. You want to see a steep fall—ideally a minimum of a 30–40% decline in a short period. - Draw two parallel lines around consolidation
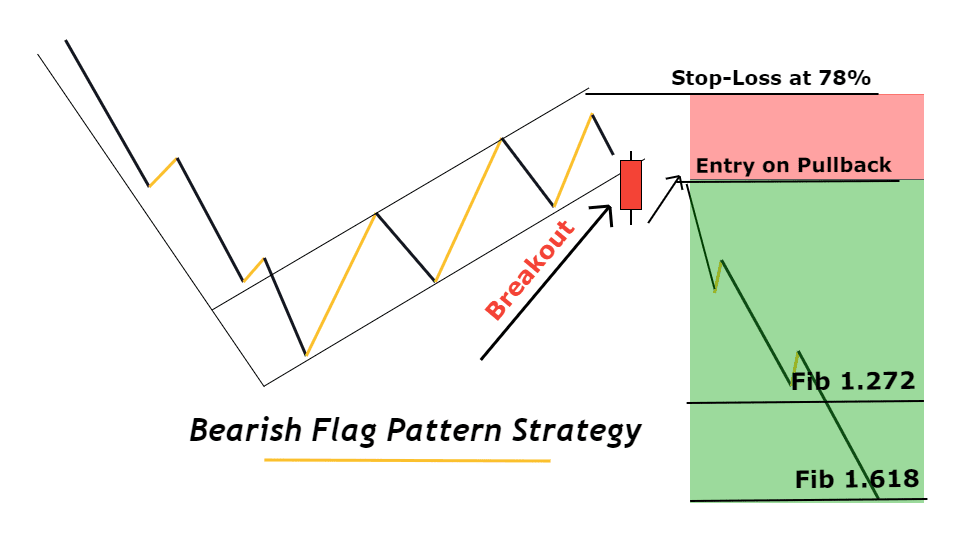
The upper line links latest highs of the flag, and the lower line links latest lows. Only treat a bearish flag as a continuation pattern if price stays inside the channel. - Take a sell entry when price breaks below the lower trendline
A close below the line signals sellers have control. Some traders wait for a retest, but a close is usually enough. Place stop-loss above the upper flag line or recent swing high. - Project a price target
Measure the height of the flagpole and subtract it from the breakout point. If price fell $10 and breaks at $50, a target of $40 is reasonable. Use this for risk-to-reward calculation.
Technical Tools and Confirmation
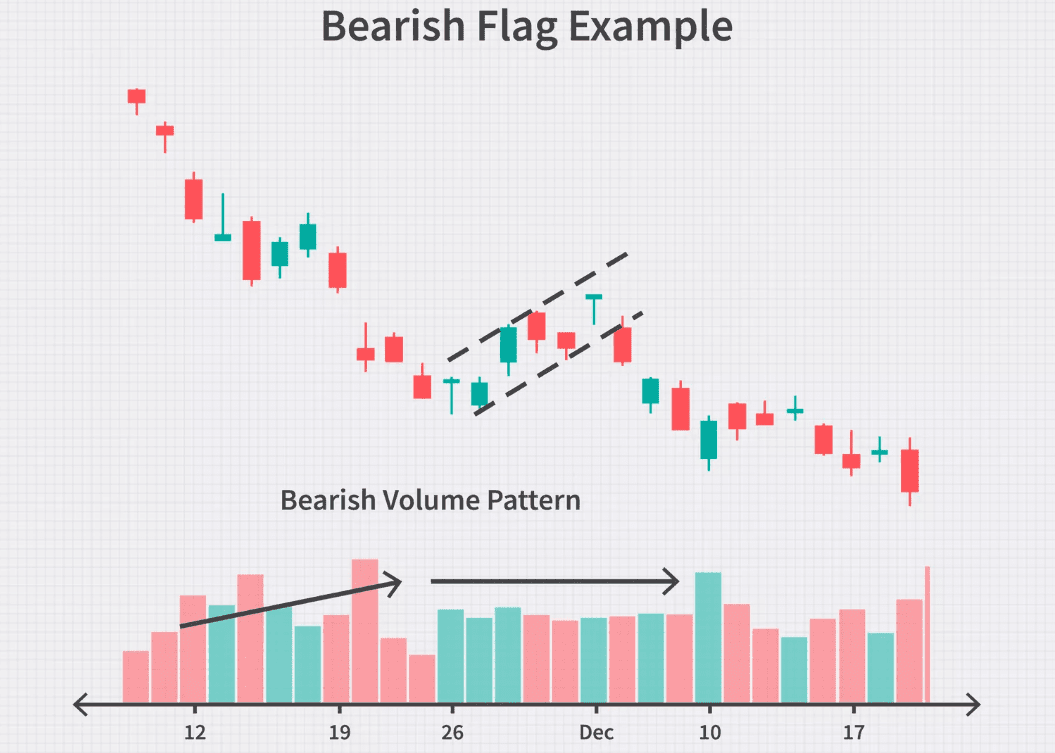
One of the strongest confirmations of a bearish flag is volume:
- Spike during the drop,
- Drop during the flag,
- Increase on the breakout.
Indicators to confirm:
- RSI: Moves up from oversold during flag, remains below 50, drops again on breakout.
- Moving Averages: Short MA crossover to the downside can signal breakdown.
- ADX (Average Directional Index): Values >20–25 during flagpole = trend strength. High ADX during consolidation suggests continuation.
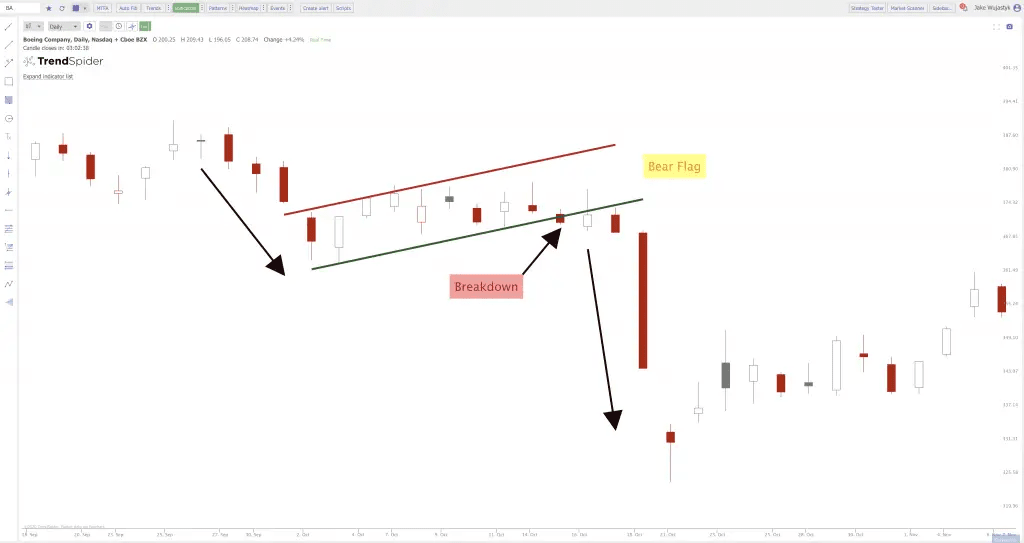
Real-World Examples and Case Studies
- Apple (AAPL), late 2018
Decline from ~$230 to ~$140, then ranged between $150–$155. Break below $150 led to ~$130 — near-perfect projection. - Bitcoin, September 2019
Fall from $12,000 to $9,000. Then traded in tight $9,500–$10,000 range. Broke down toward $8,000 on volume.
In both cases, context matters: Apple was saved by earnings; Bitcoin extended on sentiment. Combine flag patterns with broader market analysis.
Influential Analysts and Publications
- John J. Murphy
Popularized flags in 1999. Said they work best in liquid markets. Warned about false breakouts — volume is key. - Martin Pring
In Technical Analysis Explained, describes flags as continuation patterns. Recommends flags last under 3 weeks and defines width-to-pole ratios. - Other sources:
Investopedia and StockCharts provide tutorials and historical charts.
Academic research notes flags as mixed-reliability patterns, especially in low-volume markets.
Limitations and Risks
No chart pattern is infallible.
Key risks:
- Macroeconomic shocks (e.g. rate cuts) invalidate setups.
- Timeframe conflicts — patterns on short charts (e.g. 5-min) may fail against longer trends.
- Reversals on volume — breakout upward from a flag = invalidation.
Always check context and volume. Cut losses if breakout goes wrong.
Practical Applications in Contemporary Markets
Bearish flag works in all liquid markets: stocks, forex, crypto, futures.
Crypto often forms flags due to fast volatility and 24/7 trading.
Algorithms look for:
- 5–10 bar steep drops,
- 3–7 bar tight consolidations,
- Breakout on volume.
Retail traders can:
- Use TradingView,
- Set trendline alerts,
- Filter with ADX, RSI, or volume.
Checklist before entry:
✅ Steep pole
✅ Tight flag
✅ Low volume in flag
✅ Volume spike on breakout
Objective Analysis and Reflective Conclusions
Studies show mixed performance:
- Work well in some futures,
- Less so in equities.
🔎 Backtest your setup first.
Add filters:
- Trade only below long-term MA,
- Use market sentiment for confirmation.
The flag is a tool, not a principle. Combine it with other confirmations for best results.
FAQ
What exactly defines a bearish flag pattern?
A bearish flag begins with a strong downward move called the flagpole. That is followed by a tight channel where price drifts slightly higher or sideways. Finally, the pattern completes when price closes below the lower boundary of the channel on higher volume. The key is the sharp drop, narrow consolidation, and renewed selling pressure.
How long should the flag consolidation last?
Consolidation usually lasts between three and fifteen bars on daily charts or a similar range on lower time frames. If the flag extends too long—say more than three weeks on daily bars—it may lose its effectiveness, as the market might have absorbed all selling pressure or changed direction.
Can bearish flags appear in all markets?
Yes, bearish flags show up in stocks, forex, futures, and cryptocurrencies. Anywhere you find active trading and large moves, you can spot flags. However, flags tend to be more reliable in liquid markets where participation is high and data reflects real supply-demand shifts.
What role does volume play in confirming the pattern?
Volume should spike on the initial drop, fall during consolidation, and then rise again when price breaks below the flag. If volume does not increase on the breakout, the move might lack conviction, increasing the chance of a false signal. Watching volume gives additional confidence.
How do you set a stop-loss when trading a bearish flag?
Common practice is to place the stop-loss above the flag’s upper trendline or above the latest swing high within the flag. That way, if price rises beyond that point, it suggests the selling pressure has weakened, and the pattern may be invalid.
Are there common mistakes traders make with bearish flags?
One mistake is forcing a flag pattern onto any consolidation, even if the initial drop was too small. Another is ignoring broader market context—trading a flag during a strong overall uptrend often leads to losses. Failing to watch volume confirmation also causes many false breakouts.
Where can I learn more about bearish flags?
Books like John J. Murphy’s “Technical Analysis of the Financial Markets” and Martin Pring’s “Technical Analysis Explained” include chapters on flags. Websites such as Investopedia and StockCharts offer free tutorials and chart examples. For academic research, look for studies on continuation patterns in journals like the Journal of Technical Analysis.
Die im Text geäußerten Meinungen und Einschätzungen sind die Ansichten des Autors des Artikels und stimmen möglicherweise nicht mit der Position von Cryptogeek überein. Vergessen Sie nicht, dass die Investition in Kryptowährungen und der Handel an der Börse mit Risiken verbunden sind. Stellen Sie vor dem Treffen von Entscheidungen sicher, dass Sie Ihre eigenen Recherchen zum Markt und zu den Produkten durchführen, an denen Sie interessiert sind.

Author and journalist. Have a bachelor's degree in History and several years of experience in different media


Top Tutorials
-
Что такое хард-форк? Подробный гайд для новичковJul 27, 2020
-
Стейкинг на Ethereum 2.0 и его основные особенностиAug 01, 2020
-
Инновации на основе блокчейна в сфере энергетикиAug 03, 2020
Hier sind noch keine Kommentare. Sei der Erste!