How To Read Cryptocurrency Charts
May 24, 2022
1
Cryptocurrency charts show the best opportunities in the market thus are an essential part of every cryptocurrency exchange. It is impossible to become a successful trader without knowing how to read cryptocurrency charts.
Contents
Technical Analysis
Traders use technical analysis for predicting the coming price movements based on the market data. The relevance of prices depends on how the market succeeded in collecting all the required information.
Technical analysis for statistics on how the asset’s supply and demand would affect the future price changes. Also, technical analysis helps traders to notice a number of market trends and foresee the asset’s price growth, so that it becomes easier to decide whether to buy or to sell.
Some traders strongly believe that several historical moments will finally repeat themselves. And they are partially right as bearish and bullish movements return constantly forming a bear or a bull run:
- The “bulls” keep buying, when the price grows;
- The “bears” are selling, when the price drops.
Crypto charts and technical analysis are created to monitor each and every market movement and detect the best trading opportunities. If traders know how to read crypto charts, they can easily predict the beginning of such a movement.
Dow’s Theory
Charles Dow’s theory is based on the idea of measuring the basic market trends according to the business conditions. In 1884, he also introduced technical analysis, altogether with the first stock index in the world. He called it after himself: the Dow Jones Transportation Index (DJT). And soon after the Dow Jones Industrial Average (DJIA) was presented.
As Charles Dow was the founder of the Wall Street Journal, all the useful ideas were published there. The present form of the Dow theory was created after Dow’s death with some contributions from other analysts.
This theory has 6 main components, also known as the Six Tenets of Dow theory:
- The market discounts everything;
- There are 3 kinds of market trends;
- Primary trends are split into 3 phases;
- Indices must confirm each other;
- Volume should confirm the price;
- Trends persist until there is a clear reversal.
The market discounts everything
The tenet states that the market represents all the info concerning a particular asset is reflected in its price. For example, if there is good income, the market prices would immediately rise.
This rule resembles the Efficient Market Hypothesis (EMH). But the EMH stands for the prices that represent all available information and trade at equal value on stock exchanges.
There are 3 kinds of market trends
Primary trends are the main market movements and can go on for months or even years, representing both bull and bear markets.
Secondary trends are pullbacks in bull markets, when the asset’s prices move back, or rallies in bear markets, when prices suddenly move up before continuing falling. That makes secondary trends topple the primary.
Tertiary trends last for about a week and don’t affect the long-term movements. They can be easily ignored.
Primary trends are split into 3 phases
Those phases are:
- Helping smart traders to get ready for a new upcoming trend. If it is a bull market, traders should store, whereas if a bear market comes, sell.
- While the market is dealing with a new primary trend, traders either start buying more assets to take an advantage, or selling to cut losses. Because of the public participation, prices either increase or decrease rapidly.
- People still continue to speculate while the trend is about to end. It is called either the excess phase during the bull market, or the panic phase during bear markets.
Indices must confirm each other
The main rule is really simple: a new market trend starts only when both indices confirm each other. In case when one index stays the same and the second confirms the beginning of a new trend, traders should not follow the changes.
Volume should confirm the price
Trading volume is an indicator of how long an asset has been traded over a certain period. According to it, the trend with low volume is weak, while the one with large trading volume signals is strong. Trading volume is supposed to increase when the price follows its primary trend, and decrease when it doesn’t.
Trends persist until there is a clear reversal
And the last component of the Dow theory says that traders should not confuse the minor changes in the primary trend with the beginning of the secondary.
How to Read Crypto Candlestick Charts?
Candlestick charts are the most common type of crypto charts. They are more informative and are easier to analyze. Yet, many traders wonder how to read crypto candlestick charts.
Crypto candlestick charts show time across the horizontal line and private data on the vertical axis. The candlesticks themselves show the positive or negative price movement.
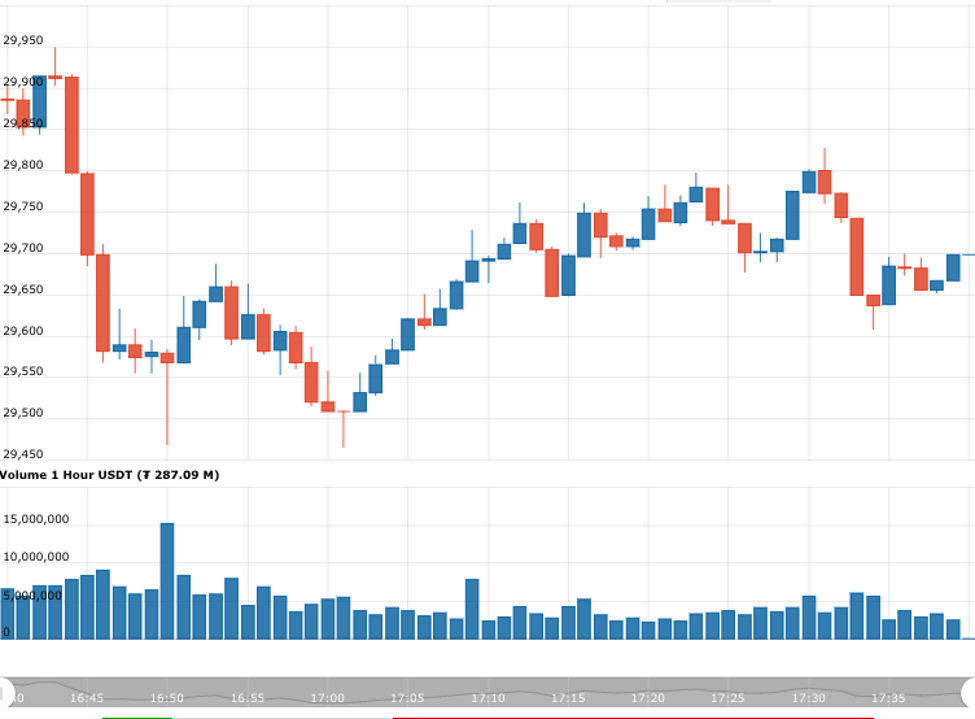
The chosen trading period depends on the traders’ preferences: style and strategy mainly. If a crypto trading chart is set to a six-six timeframe, each candlestick will represent six hours of trading activity.
The candlestick consists of a body and wicks. The body shows its opening and closing prices, the top wick shows the highest point, and the bottom wick shows the lowest point of the price. A long wick on top means that traders are taking profits and selling time might come soon. A long wick at the bottom means that traders are buying only when the price drops. If the body occupies almost all the space of a candlestick, and the wicks are very short, it may mean either strong bullish or bearish movement. And, finally, if a candlestick got almost no body and only long wicks, then neither buyers nor sellers are controlling the asset.
That's all what the traders need to know for a successful crypto candlestick chart reading.
Support and resistance levels
Trending lines, also known as support and resistance levels, were created to help reading live crypto candlestick charts. These are a series of prices, connected with each other on charts, forming trendlines.
Support levels are the lowest price points during pullbacks in which cryptocurrencies are expected to halt till buying interest activates. Resistance levels are the highest price points when selling interest prevails. Both buying and selling interests make it hard to overcome those levels.
Support and resistance levels can be identified with the help of trendlines. An uptrend line goes from a cryptocurrency’s lowest to the second-lowest lows in a given timeframe and the levels touching this particular trendline are called the support levels. On the contrary, a downtrend line is drawn using the crypto’s highest and second-highest highs, while the levels touching this line are called the resistance levels. Knowing this information, some technical analysts just buy near the support of uptrend lines and sell near the resistance of downtrend lines.
What are moving averages?
Moving averages always go together with the support and resistance levels. A moving average (or MA for short) is one of the most popular types of technical indicators.
Moving averages rely on the past prices to form the statistics. That’s why traders use MA as signals to buy and sell crypto assets, according to particular periods on the timeframes.
Moving averages can be of three types:
- A simple moving average (SMA) shows the average price of an asset over a particular period and divides it by the number of subperiods.
- A weighted moving average (WMA) gives more weight to recent prices to make them more responsive.
- An exponential moving average (EMA) gives more weight to recent prices but is not consistent with the rate of decrease between one price and its preceding price.
Usually moving averages are used for 10, 20, 50, 100, or 200-day periods to make market trends more visible and clear. There are two curious tendencies that can occur with the 50/200-day SMA:
- A death cross or a huge price drop, when the 50-day SMA crosses below the 200-day SMA.
- A golden cross or a huge price rise, when the 50-day SMA crosses above the 200-day SMA.
Other Main Technical Indicators
Except for the moving averages and their categories, there are a couple more main technical indicators. Let’s have a closer look at them.
On-balance volume indicator (OBV)
The on-balance volume indicator is a technical indicator concentrating on a cryptocurrency’s trading volume. It is an unstable indicator that rises and falls according to the trading volume of the days forming the period.
The OBV is also used to confirm the trends. For example, when traders look at live crypto charts, they can see price changes accompanied by a rising or falling OBV.
The on-balance volume indicator is calculated with the help of three more measures: MACD, RSI, and Bollinger bands.
Moving average convergence divergence (MACD)
The moving average convergence divergence measures the difference between the 12-day and 26-day EMAs. The MACD line identifies both buy and sell signals.
When the 12-day EMA crosses below the 26-day EMA, the MACD shows a sell signal, and vice versa. The greater the distance between the lines, the stronger the MACD is.
This indicator can also have a 9-day EMA signal line.
Relative Strength Index (RSI)
The relative strength index (RSI) gives a signal if an asset is being overbought or oversold. It is a kind of oscillator and can vary from 0 to 100. A cryptocurrency is considered oversold when the value drops below 30, and overbought when its value moves over 70. In this case “overbought” is a sell signal, while “oversold” is a buy signal.
The RSI uses a 14-day timeframe.
Bollinger bands
John Bollinger created the Bollinger bands, which helps traders identify some short-term price movements. The Bollinger bands use only a 20-day MA.
It is important to know that periods of low volatility are followed by periods of high volatility:
- When the bands are separate during periods of high volatility, the ongoing trend may be finishing soon;
- When the bands are close together, the asset may show high volatility.
The bands showing periods of higher or lower volatility can be used with different indicators.
Conclusion
Bitcoin and other cryptocurrencies are still popular among traders. So, having learned the basic information on how to read cryptocurrency charts, everything left for a trader is to select an exchange and have some practice.
텍스트에 표현 된 의견과 평가는 기사 작성자의 견해이며 Cryptogeek의 입장을 나타내지 않을 수 있습니다. 암호 화폐에 투자하고 거래소에서 거래하는 것은 위험과 관련이 있다는 것을 잊지 마십시오. 결정을 내리기 전에 시장과 관심있는 제품에 대해 직접 조사하십시오.

Author and journalist. Have a bachelor's degree in History and several years of experience in different media


인기 튜토리얼
-
Что такое хард-форк?Jul 27, 2020
-
Стейкинг на Ethereum 2.0 и его основные особенностиAug 01, 2020
-
Инновации на основе блокчейна в сфере энергетикиAug 03, 2020
mail: jeffsilbert39 gmail. Com
WhatsApp +84 94 767 1524 Or WhatsApp 1 (470 ) 469-9769.
I advice everyone to always be careful because my experience with them cost me mentally and financially, thankful to the security agency that helped me to investigate and recovered my money mail Jeff on Jeffsilbert39 g Ma il c0m