Syscoin (SYS) Price Prediction 2022-2030. Should You Buy It Now?

Syscoin (SYS) is among the first 200 cryptocurrencies according to CoinMarketCap.
The peculiarity of this crypto is that it merges the best features of Bitcoin and Ethereum - the first two cryptocurrencies by market capitalization - and allows to improve their functionalities by reducing costs at the same time.
With this article we want to provide you with a complete analysis of Syscoin and with possible price predictions from 2022 to 2030.
Of course, this is not financial advice: we just want to give you an idea of the possible future price movements of this crypto.
Always do your own research before investing!
What Is Syscoin (SYS)?
As we mentioned, Syscoin (SYS) wants to merge the best characteristics of both Bitcoin and Ethereum.
| The price as of February 2022 | $0.751852 |
| Market cap as of February 2022 | $478,943,471 |
| Rank as of February 2022 | #155 |
| All-time high | $1.3 (January 2, 2022) |
| Decline (compared to all-time high) | 41.8% |
| All-time low | $0.00020971 (Februry 22, 2015) |
| Growth (compared to all-time low) | 361066.5% |
| Popular markets | Binance, Gate.io, Bittrex, BKEX, AEX |
Founded in 2013 by Jag Sidhu - Blockchain Foundry’s Chief Technology Officer and also Syscoin Core Developer - Syscoin was able to position itself among the first 200 cryptocurrencies in the market.
The technology behind SYS is very innovative, and the creator of this crypto takes into account third-party evaluation to keep track of the results of the project: the Whiteblock Z-DAG Analysis showed that the blockchain behind SYS is able to allow from 14,000 to 30,000 transactions per second (TPS). This is an impressively high number if you consider that Ethereum is able to handle approximately 30 TPS, while Bitcoin only records around 5 transactions per second.
But let’s see in detail what Z-DAG is.
Z-DAG means Zero Confirmation Directed Acyclical Graph. This is simply a protocol used to verify transactions which is complementary to Proof-of-Work (PoW).
While the main issues solved by the blockchain technology still find a solution - like the double spending problem - Z-DAG allows nodes to just verify the sequentiality of transactions included in memory pools. This allows almost real-time verifications, and this means that the blockchain works extremely faster.
Another feature of Syscoin is that this crypto is sustainable: as Jag Sidhu clarifies in his article on Medium, Syscoin (SYS) is “merge-mined with Bitcoin”. Nodes can use the same energy spent by Bitcoin miners to verify SYS’s transactions.
Moreover, SYS has decentralized governance.
The most interesting function of Syscoin is that you can use the platform to easily create your own token or your own NFT - non-fungible token. You can even create Fractionalized Non Fungible Tokens (F-NFTs), so people can be able to own just a part of an NFT. Users can also develop decentralized applications on top of the blockchain, receive funding for their projects and join the open-source community.
Syscoin (SYS) Price Analysis Of The Past Years
After analyzing the technology behind Syscoin, an historical analysis will help us to understand how the price of this asset moved in the past years to better understand what possible value it will have in the future.
2016
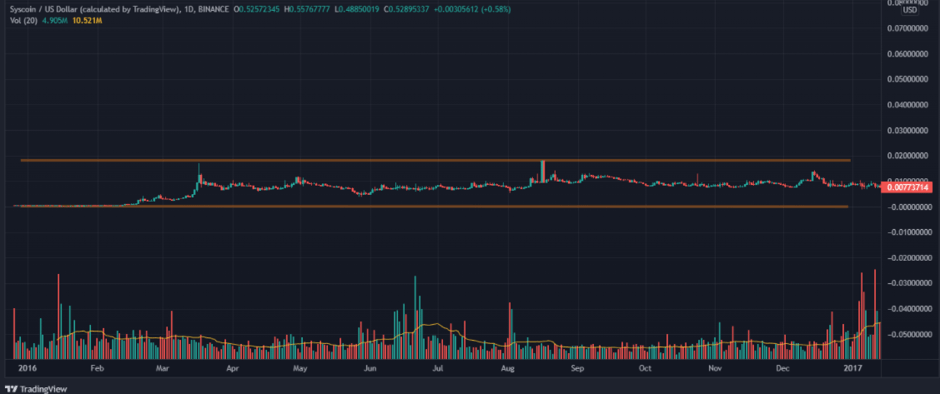
2016 was not a great year for Syscoin (SYS).
The price remained stable, moving in a range between $0.002 and $0.019. It was a long lateralization period.
2017
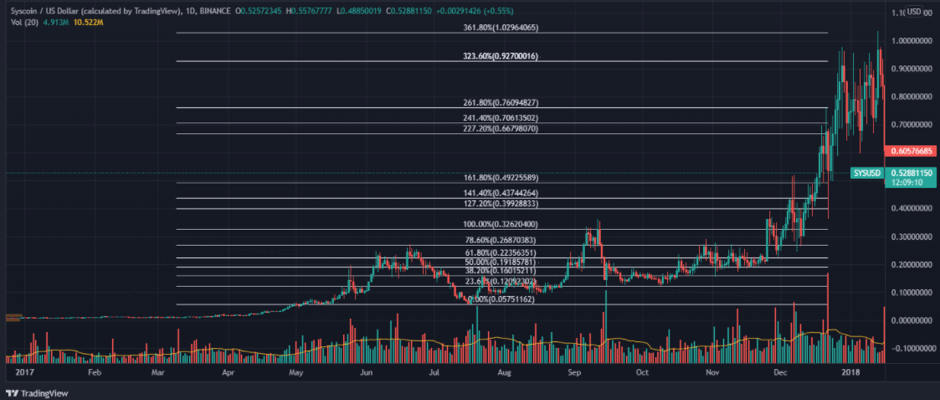
After the lateralization period, the price started a long period of recovery.
In the middle of April, a new uptrend began.
The first resistance point was found at around $0.27 - at the 78.6% Fibonacci extension level.
After the first swing high, the price experienced a short-term retracement to around $0.055. The swing low, reached on July 17th, was followed by a positive peak in volume.
The peak resulted in a new positive price wave: the second swing high was reached on September 11th, when the price reached $0.32.
This second swing, and the second - and higher - positive peak in volume, was the confirmation of the strong uptrend.
The impressive uptrend exceeded $1, reaching $1.03 in a few months - at the beginning of 2018.
2018
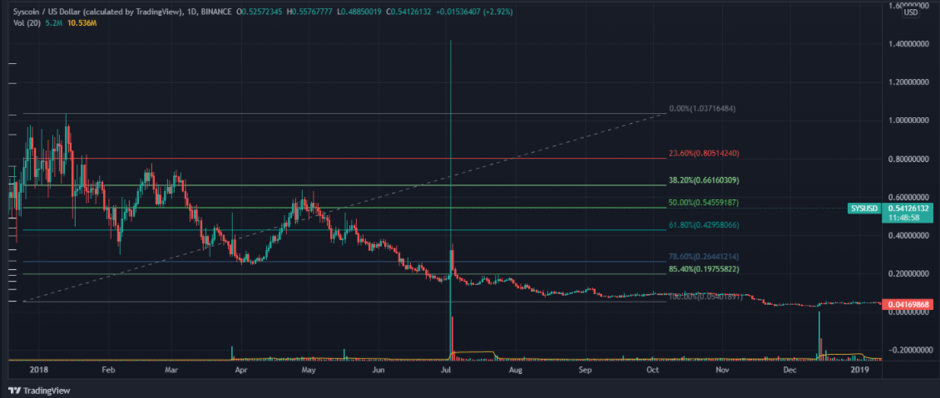
From the middle of January 2018 began the last phase of that price cycle.
A downtrend started: the price reached the Fibonacci retracement level 61.8% before a short recovery - that led the price to $0.71 (23.6% Fibonacci retracement level).
The next wave of the downtrend came soon after, and led the price of Syscoin (SYS) to the Fibonacci retracement level 78.6% - at around $0.26.
After a fast recovery that led the price to $0.58, the downtrend went on and reached the 100% Fibonacci retracement level in September.
During 2018 a curious fact happened. On July 3rd (you can see the impressive peak in price in the image below) there was an abnormal surge in price - that reached a high of over $1.4 after an opening price of $0.18 (data from Binance).
This was the result of an impressively high buy order on Binance, and even if the crypto community thought at first that the issue was the Syscoin blockchain, it is very problable that the issue was with Binance: on July 4th the platform announced a system maintenance, while the Syscoin team admitted that even if it had registered odd trading activity, the blockchain was extremely safe.
2019
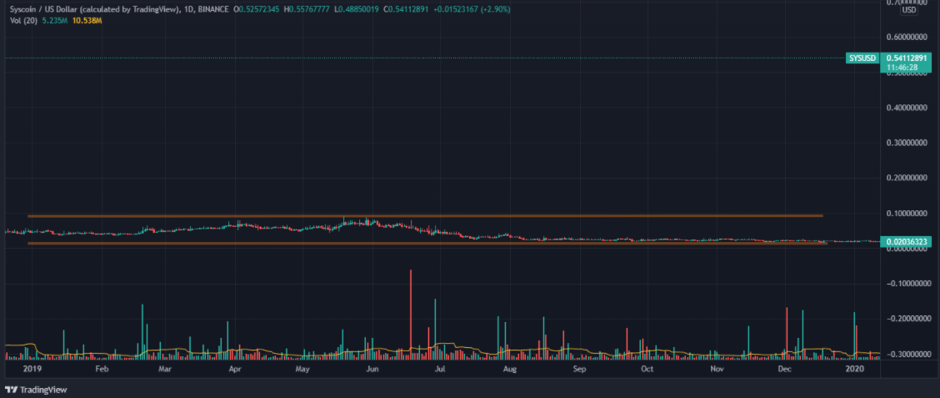
After the complete cycle, the price moved sideways for the whole year, in a price range between $0.018 and $0.09.
2020
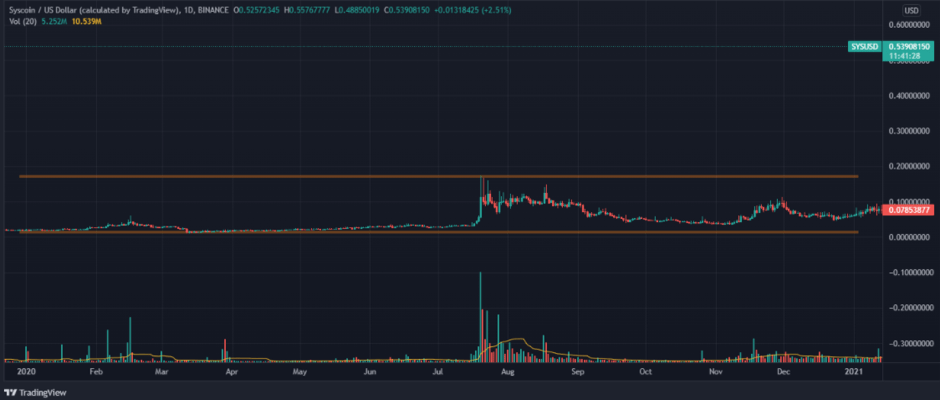
In July 2020, the price started a recovery that led the price to $0.17. Then, it got back to $0.035.
2021
The recovery of 2020, that corresponded to a peak of positive volume, was confirmed in 2021. The price exceeded $0.9 on May 5th.
Then, a short downtrend began, and led the price below $0.15 again - at the 85.4% Fibonacci retracement level. But the price recovered again, and the uptrend is not yet finished.
After this analysis we can try to make predictions for the price of Syscoin from 2022 to 2030.
Even if our predictions are the result of fundamental and technical analysis, experts’ analysis and data, you should always do your own research, because no forecasts can be perfect.
Syscoin (SYS) Price Prediction 2022
The price of Syscoin should rise in 2022, reaching at least $0.9.
Syscoin (SYS) Price Prediction 2023
If compared to the price of 2022, SYS should still rise in 2023 to exceed $1.5, reaching around $1.8.
Syscoin (SYS) Price Prediction 2025
In 2025, the price of Syscoin should even exceed $3, and reach a price of 3.5 US dollars.
Syscoin (SYS) Price Prediction 2027
In two years - from 2025 to 2027 - the price of Syscoin should double its value and exceed $7.
Syscoin (SYS) Price Prediction 2030
From 2027 to 2030 the price of Syscoin (SYS) should triple its value and reach $21. There is a possibility that the price will even go further.
| Year | Min Price | Average Price | Max Price |
| 2022 | $0.9 | $0.94 | $1.02 |
| 2023 | $1.52 | $1.54 | $1.81 |
| 2024 | $2.17 | $2.25 | $2.49 |
| 2025 | $3.03 | $3.13 | $3.6 |
| 2026 | $4.83 | $4.88 | $5.72 |
| 2027 | $7.04 | $7.21 | $8.28 |
| 2028 | $9.67 | $10.15 | $11.54 |
| 2029 | $14.1 | $14.55 | $16.91 |
| 2030 | $21.65 | $22.03 | $24.4 |
Conclusions
Syscoin (SYS) is an interesting crypto backed by a decentralized project.
With this article we wanted to show you its main features and functionalities. With no doubt, the most interesting aspect of this crypto is that it managed to merge the best features of Bitcoin and Ethereum: born from a Bitcoin fork, it still keeps its Bitcoin’s consensus mechanism, profits from the energy used to mine it, but also allows users and developers to create NFTs, tokens, decentralized applications - as Ethereum.
But SYS improved the first two cryptos by market capitalization in terms of speed, transactional costs and scalability.
Keeping into account Syscoin’s tokenomics, technical analysis and experts’ opinions, we also provided you with forecasts from 2022-2030: of course, we are not sure that the future price of SYS will correspond to our predictions - no one can - so don’t take this article as financial advice.
The analysis can be useful to understand where Syscoin could go, but - as we said many times in this article - always do your own research before investing!


Here are no comments yet. Be the first!