Introduction To Price Action Trading For Beginners

Sep 20
0
Price action trading relies on the analysis of historical price data to identify trading opportunities. The basic premise of price action trading is that all the information that is needed to make a trading decision is contained in the price chart.
Paul Tudor Jones, a distinguished investor and trader, vouched for price action trading's efficacy. He highlighted the paramount importance of an insatiable desire for knowledge in trading success.
"The secret to being successful from a trading perspective is to have an indefatigable and an undying and unquenchable thirst for information and knowledge."
One of the most compelling reasons to opt for Price Action Trading lies in its simplicity and efficiency. Unlike other trading methods that require a lot of indicators and a deep understanding of complex theories, Price Action Trading offers a more straightforward approach that even beginners can grasp relatively easily. This focus on price charts, stripped of external indicators, allows for more direct and uncluttered analysis. So, we wrote a beginners guide just for you, which offers an in-depth overview of Price Action Trading - from the basics to real world trading examples on the charts.
What Is Price Action Trading?
Price Action Trading is a method of technical analysis focusing exclusively on historical price data to forecast future market trends. This is distinct from fundamental analysis, which evaluates an asset's inherent worth through external conditions and financial reports. In Price Action Trading, the primary assumption is that the price chart contains all necessary data for trade decision-making.
The foundation of this methodology rests on the interplay between supply and demand forces in determining asset prices. Specifically, a bullish trend is observed when demand exceeds supply, while a bearish trend occurs when supply outstrips demand. This approach offers a direct mechanism for assessing market sentiment, thereby enabling prompt trading actions.
Besides the simplicity of price action trading, another advantage is the flexibility it offers across different asset classes; whether you're trading stocks, forex, or cryptocurrencies, the core principles remain the same. The lack of reliance on external indicators not only streamlines the decision-making process but also encourages traders to be disciplined and adhere to their trading plans, thereby minimizing emotional biases. However, it's essential to acknowledge that, like any other method, Price Action Trading isn't foolproof. It demands time and effort to master, and because the market can be volatile, it's not always possible to identify foolproof trade setups. Nonetheless, for those looking to make well-informed trading decisions without the clutter of additional indicators, Price Action Trading offers an effective, versatile option.
Price Action Fundamentals
Candlesticks
A big part of price action is actually understanding candlesticks. In general we have to main types of candles a green one, for when the price is going up, and a red one, for when the price is going down. Another abbreviation helps to think about the most important parts of a candle (OHLC): Open, High, Low, Close.
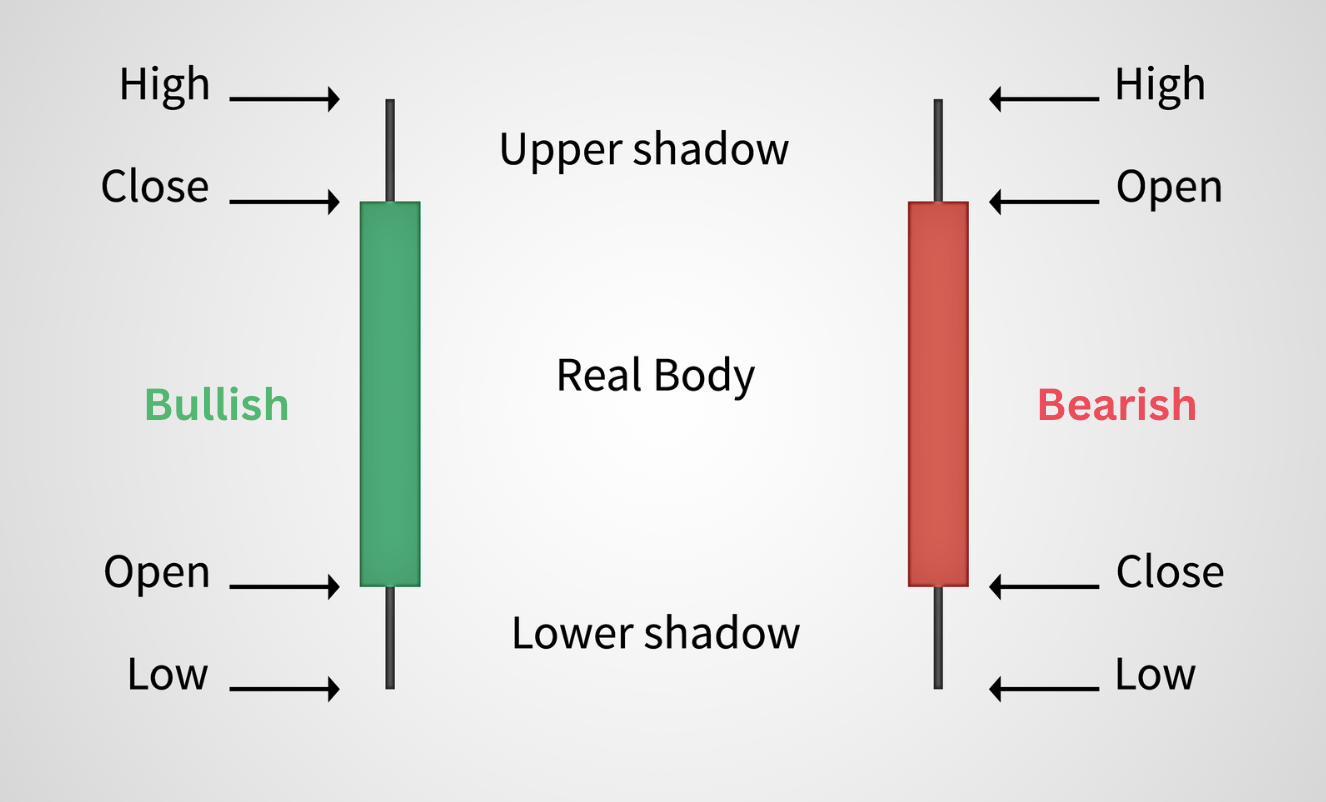
A candlestick has a rectangular "body" showing the open and close prices, and "wicks" above and below indicating the high and low prices during a specific time period.
In a candlestick, the "Open" is the price at which trading starts for a specific time period, the "High" is the highest price reached, the "Low" is the lowest price, and the "Close" is the price at which trading ends for that time period.
Timeframes
In the realm of multiple timeframe analysis in financial markets, a systematic approach is critical for generating actionable insights. The principle of aligning across different timeframes serves as a cornerstone for this analytical method. To operationalize this concept, traders commonly engage with a set of hierarchical timeframes: long-term, medium-term, and short-term.
Long-term timeframes, such as weekly or daily charts, offer the macro view of market trends and key support and resistance levels. This data provides strategic context and helps to identify the general market direction. For instance, a long-term uptrend would generally imply that shorter-term trading strategies should align with this upward momentum.
The medium-term timeframes, including daily, 4-hour, and 1-hour charts, function as a validation layer for the long-term trend. This layer involves a more detailed examination of chart patterns and technical indicators. These may include head and shoulders patterns, moving averages, or other oscillators that signal potential trend continuations or reversals. If the medium-term charts conflict with the long-term charts, it’s generally considered a red flag, advising caution or suggesting that the trader defer action until alignment occurs.
The short-term timeframes are where the granularity of the analysis reaches its peak. Generally encompassing timeframes from 1-hour down to 5-minute charts, these charts serve to pinpoint specific entry and exit points. Due to the high frequency of data points, this level contains the most "noise" and thus requires the most rigorous analytical discipline. Accurate interpretation here relies heavily on the confirmatory evidence obtained from higher-order timeframes.
When all three timeframes align in their narrative — whether it be bullish, bearish, or neutral — that is typically the optimal moment for executing a trade. However, it's crucial to note that alignment across timeframes is not a guarantee of success, but rather a risk management tool designed to filter out false signals and reduce the probability of unfavorable trading decisions.
Support and Resistance Levels
One of the fundamental concepts in Price Action Trading is the identification of support and resistance levels. These are price points on a chart where an asset has historically had difficulty moving beyond. Support levels act as a floor where buyers typically come into the market, preventing the asset's price from falling further. Conversely, resistance levels act as a ceiling where sellers enter the market, preventing the asset's price from rising further.

Live Trading Chart Example: In a Bitcoin 1-hour price chart, for instance, you might see a support level at $26700 and a resistance level at $27800. When Bitcoin's price approaches the support level, buying activity often picks up, preventing the price from falling below that point. If the asset price rises to the resistance level, selling activity tends to increase, making it difficult for the price to break through. When a breakout does occur, such as when Bitcoin surpasses $27800 that old resistance level can now act as a new support level. But beware of false breakouts where the asset retests the new support level and fails to hold it.
Candlestick Patterns in Price Action
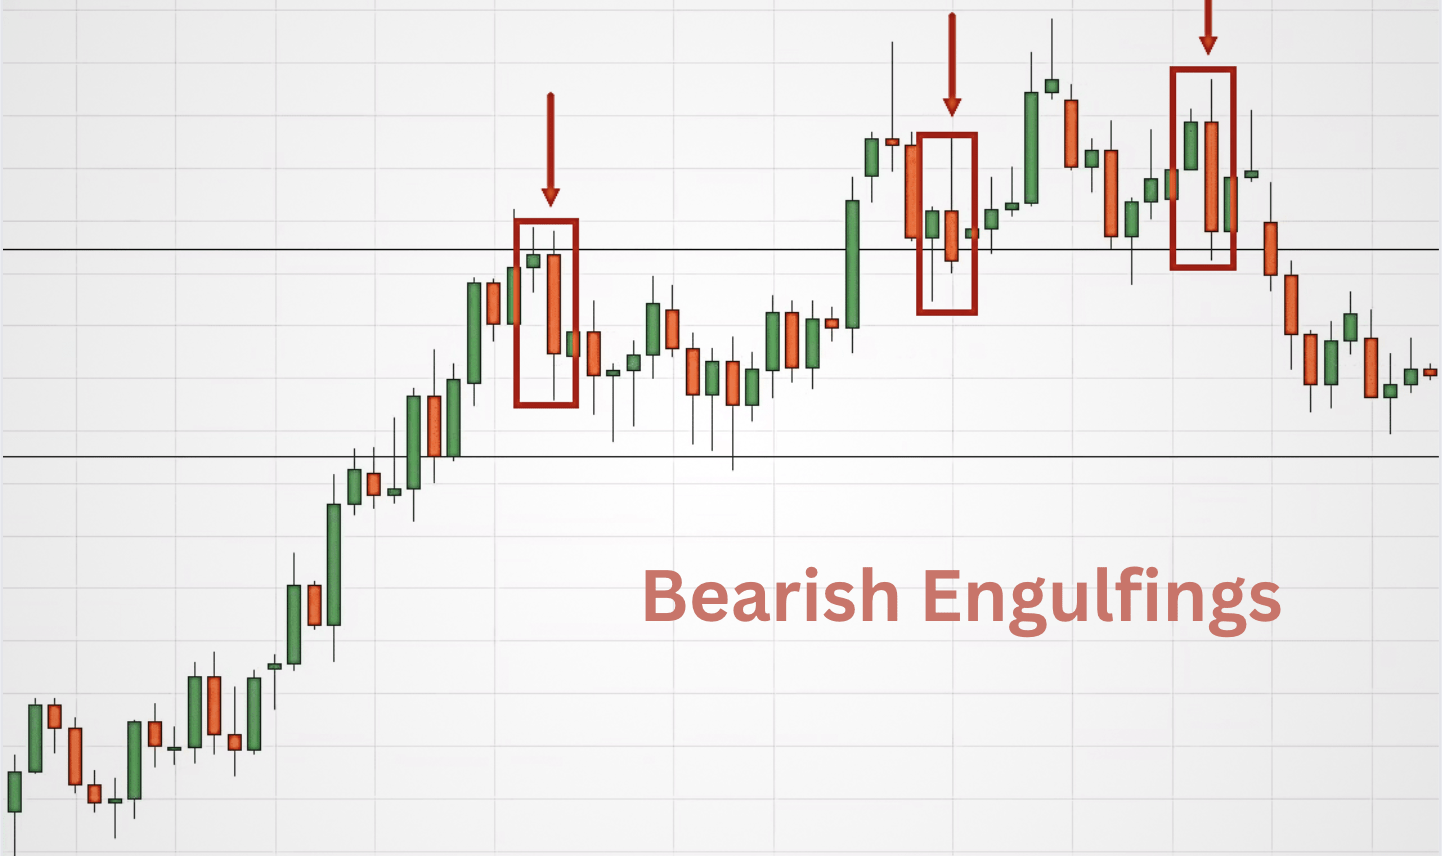
Another essential concept in Price Action Trading is the understanding of Japanese Candlestick Patterns. These patterns provide a visual representation of market sentiment and can be extremely useful in predicting future price movements.
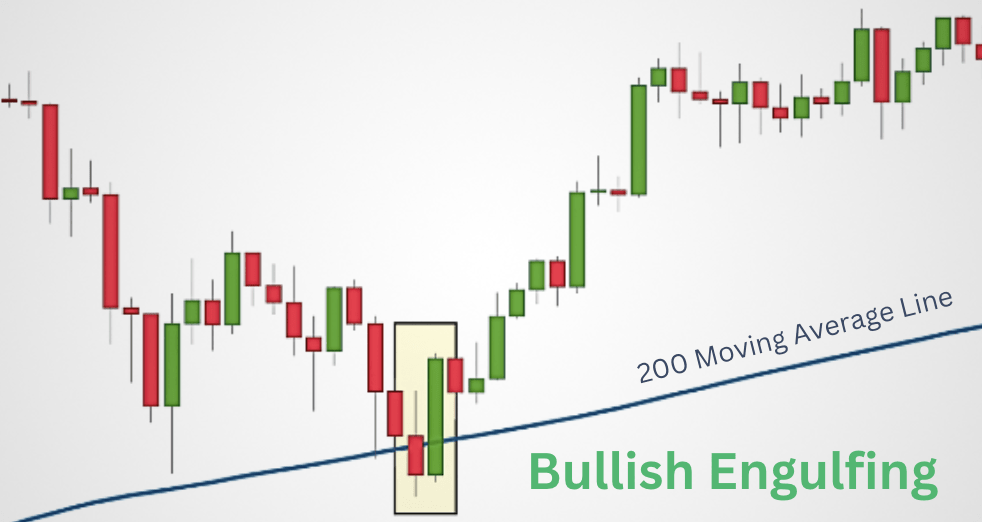
Live Trading Chart Example: An example of a common candlestick pattern is the "bullish engulfing pattern," where a large green candle follows and engulfs a smaller red candle. This is typically interpreted as a sign that bulls are gaining control and the asset's price is likely to rise. Conversely, a "bearish engulfing pattern," where a large red candle engulfs a smaller green one, signals that bears are gaining control, and the asset's price is likely to fall.
Tools and Indicators
While somewhat less emphasized than support and resistance levels and candlestick patterns, identifying trends and considering trading volume are also important. Moving averages like the Simple Moving Average (SMA) and Exponential Moving Average (EMA) can be useful tools in trend identification.
In price action trading, minimalism is often favored because it focuses on raw price data, eliminating the potential distractions and delays that can come with using multiple indicators. This approach aims for direct interpretation of market sentiment, allowing traders to make timely decisions based on price movements alone.
Moving averages are indicators that smooth out price data over a specific time period to identify trends, providing a clearer view of the price direction by filtering out market noise.
By combining these core concepts—support and resistance levels, candlestick patterns, and trend identification with trading volume—you'll have a well-rounded, effective Price Action Trading strategy. Utilizing these tools in conjunction can significantly increase the likelihood of making profitable trades.
Tips for Beginners
That brings our article to the end and we hope you were able to learn a lot in terms of new trading knowledge, especially for the topic of price action trading. Now, before you leave, let us leave you with some words of advice. For beginners in trading, starting with a demo account is advisable for risk-free practice and familiarization with trading platforms. Continuous learning, through reading, courses, and market analysis, is essential for keeping up-to-date with trading strategies and market conditions. Understanding when to engage in trading and when to abstain is critical; this discernment often hinges on market signals, risk assessment, and alignment across multiple timeframes.
Les opinions et appréciations exprimées dans le texte sont celles de l'auteur de l'article et peuvent ne pas représenter la position de Cryptogeek. N'oubliez pas qu'investir dans des crypto-monnaies et négocier en bourse est associé à un risque. Avant de prendre des décisions, assurez-vous de faire vos propres recherches sur le marché et les produits qui vous intéressent.

Author and journalist. Have a bachelor's degree in History and several years of experience in different media


Voici encore aucun commentaire. Soyez le premier!